Cyclistic Riders
Case Study
A case study about a fictional bike rental company
seeking to understand the difference in how subscribers to
their
monthly subscription and non-subscribing users use their products.
Overview
A business called Cyclistic has a bike-sharing scheme. This programme can be used in two different ways: as a one-time rental or as a monthly subscription service. The distinctions between subscribers and occasional renters' use of the service will be attempted to be outlined in this report, and I will also make some suggestions for how to persuade occasional renters to become subscribers.
Objectives
- Inspect dataset, looking for potentially relevant attributes of customers
- Observe data collected to conclude the differences between different types of customers
- Using observations, attempt to propose new ways to convert casual users of the service into subscribing members
Process
- Data was acquired from an open source dataset (available here)
- Datasets from Q12019 to Q12021 (1 year of data) loaded into RStudio, an R Programming Environment
- Data was cleaned, as certain properties collected in previous quarters were no longer being collected for recent data. In addition to this, columns had to be renamed in order to fit with new data naming conventions
- Analysis of data comparing the usage of subscribers and casual riders. In order to do so, aspects such as difference in usage on different days of week, times of year, or total ride time per trip was compared
- Create visualizations to portray differences in usage between users
- Compile report to share differences in usage and suggestions to improve subscriber number with stakeholders
Analysis
Usage Difference
subscribing members represented by blue, casual users by red
Difference in total number of rides
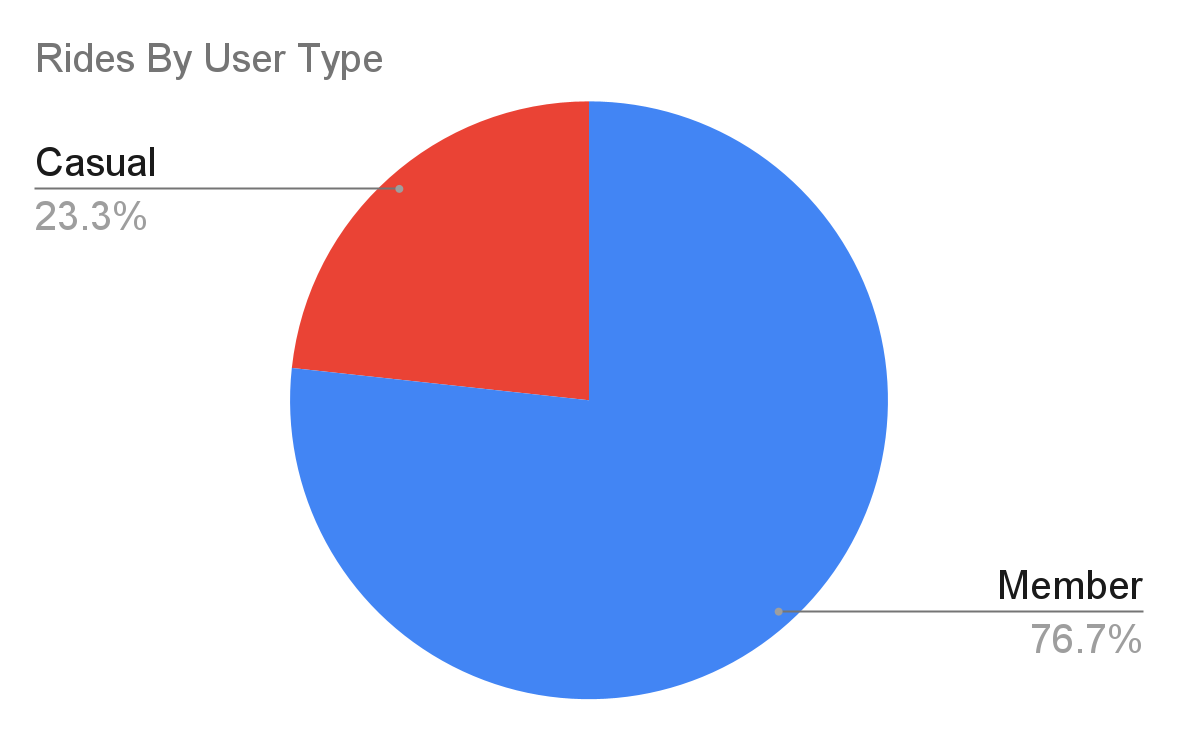
Data shows that a significantly larger proportion of rides are taken by users subscribed to the membership service.
Difference in total percentage of ride time and average ride time
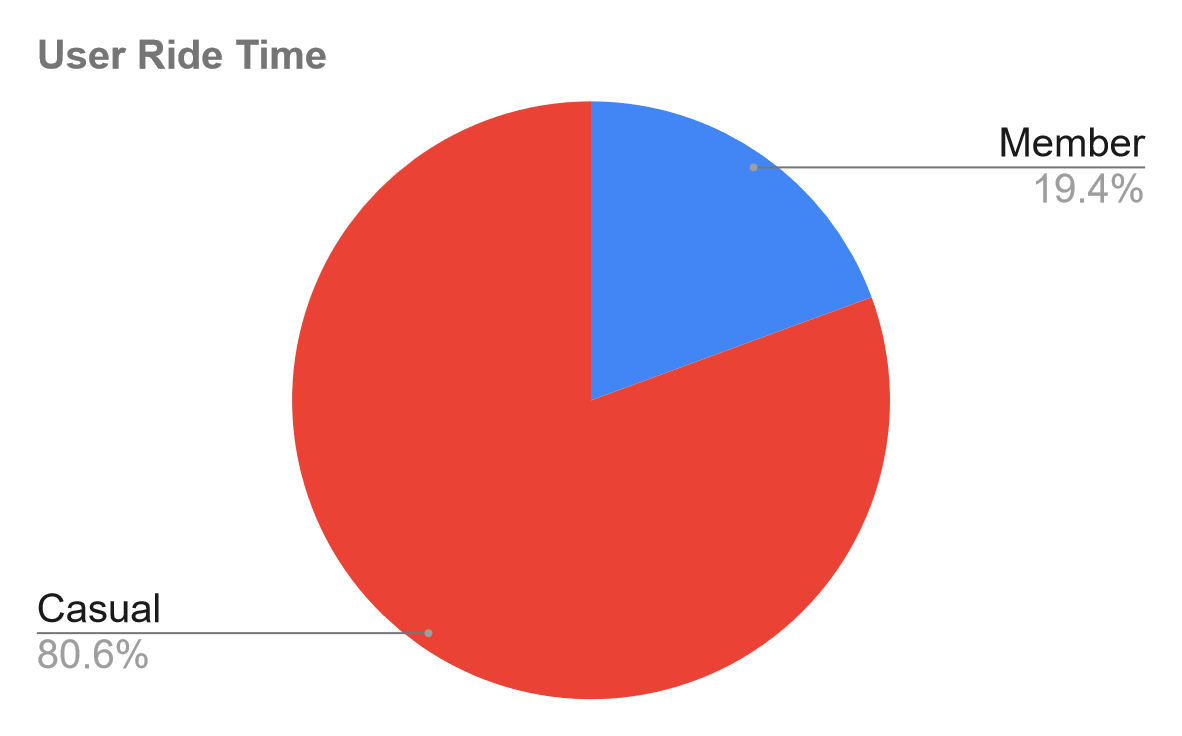
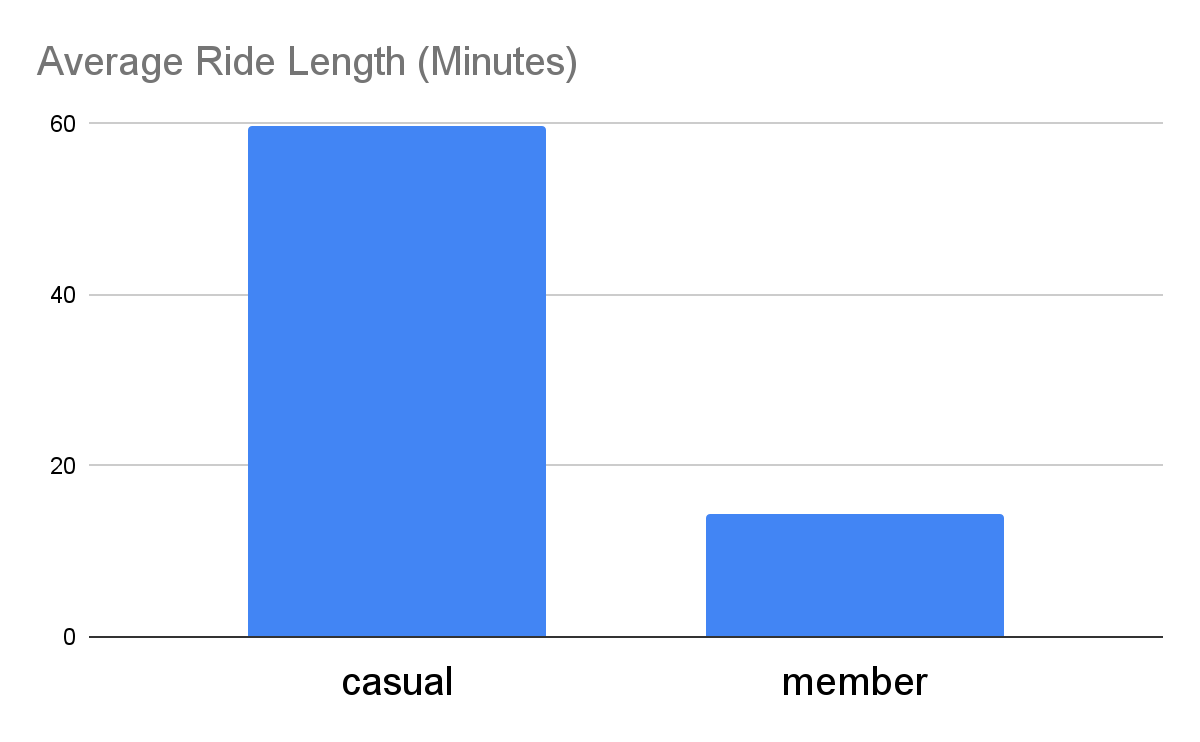
Despite most rides being taken by subscribing members, the vast majority of the total time spent riding on bikes is taken up by casual users of the service. In addition, casual users take much longer trips on average than subscribing members.
Comparison between year-round usage distribution
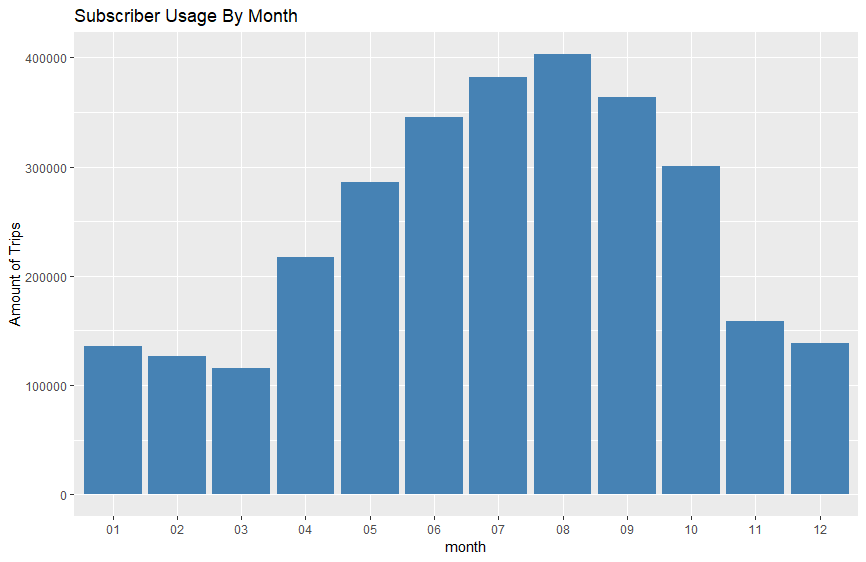
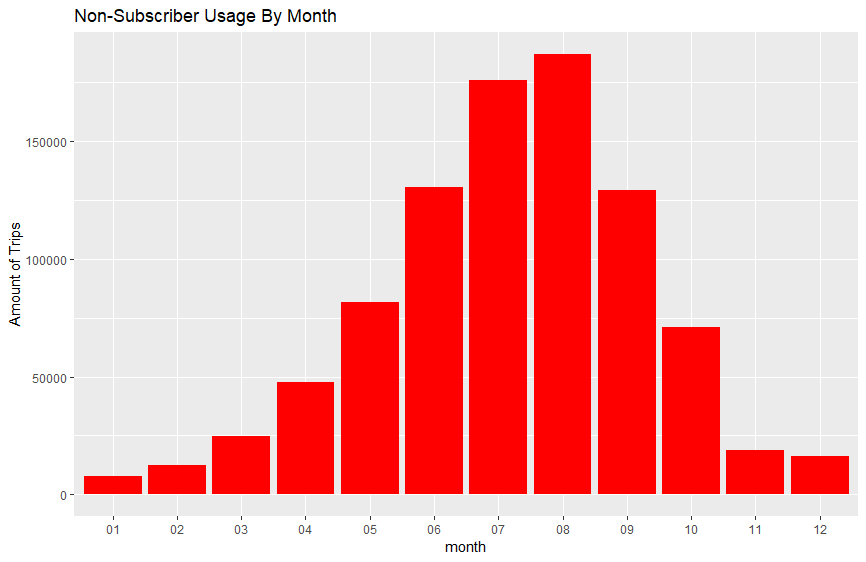
Analysis of total trips throughout the year reveals that subscribing members, while taking more trips in the summer, still utilize the service relatively consistently year-round. On the other hand, casual users of the service tend to make almost all their trips in the summer months, with very little activity in the winter.
Comparison in usage by day of the week
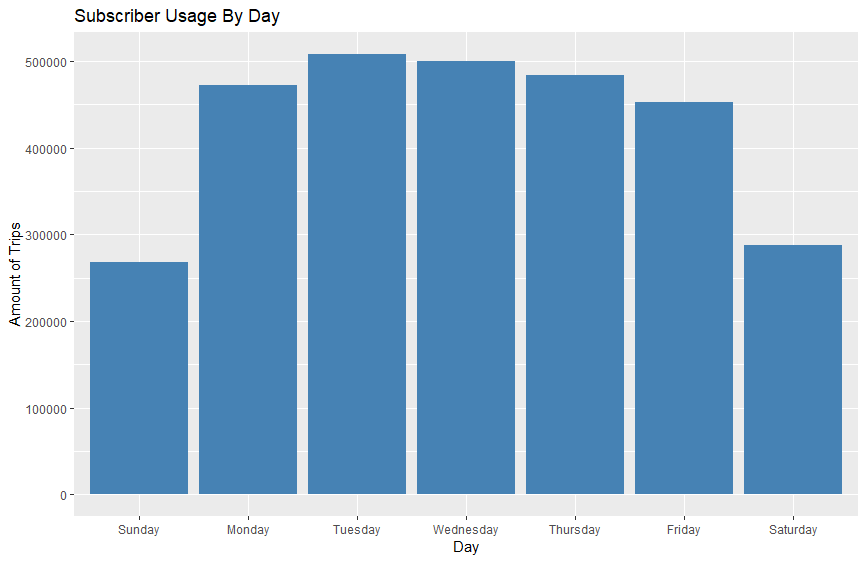
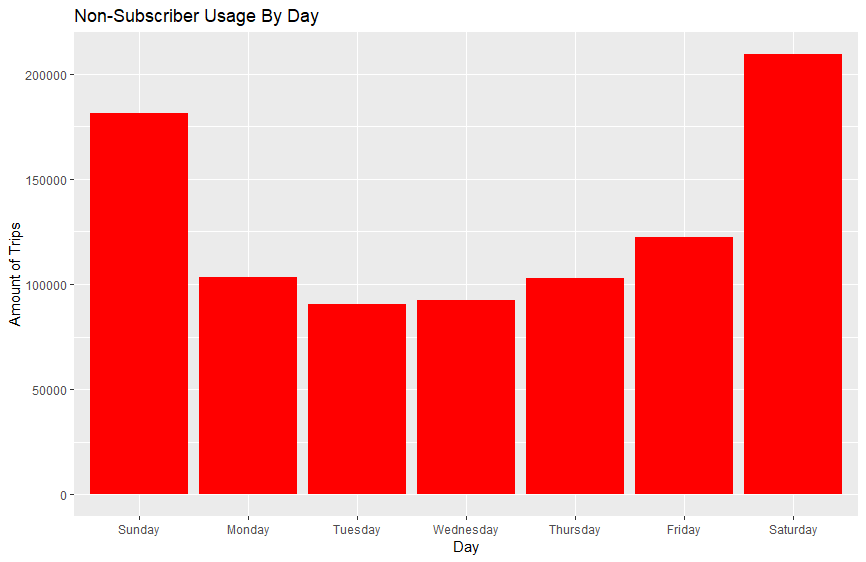
According to data collected, subscribers have a much more consistent usage of services throughout the week. Casual users are much more likely to only use services on weekends.
Conclusions
Based on analysis of the data, I have come to multiple conclusions. Firstly, we can see that most trips on our bikes are being taken by subscribers, while most actual ride time is being done by casual users of our service. From this, we can also conclude that casual users take much longer rides on average than subscribing members. Thirdly, we may draw from this data the conclusion that subscribing members are more consistent in their useage of the service, whereas casual riders are more likely to use the service during summer months and on the weekends.
Potential Reasons for Differences
My observation of the data has lead me to a few potential explanations for differences in usage. For the difference in total number of rides being larger with subscribers than with casual users, but casual users taking longer rides, I would believe that subscribers use the bikes much more in day to day life. An example of this could be a subscriber using a bike to go to and from work, or taking daily bike rides around their neighbourhood. Along with this, casual users might only be renting the bikes for riding occasionally, perhaps for tourism or exploration of the city.
Subscribers and casual users also have different days of the week and months in which they use the bikes. Casual users might be more likely to use the bikes during summer month and weekends due to being tourists or visitors to cities in which we have bikes. Another reason for this difference might be that, if the subscribers are more likely to ride bikes to work, casual users of our bikes might live too far away to use the service for this. Finally, perhaps where they live does not have access to these services, leaving them to only be able to use the bikes when coming into more population-dense areas.
Suggestions for Conversion
Some recommendations can be made for how to convert casual users to subscribing members.
First, we can see that casual users make use of the service much more during summer
months. Perhaps a sale on memberships, or a specifically summer-based membership being purchasable, might get these casual users to convert to members.
Another potential suggestion for conversion of casual users into members could be to distribute bikes among more suburban areas. Doing this might entice
users who may casually use the bikes when they come into town to convert into subscribing members, as they would have more consistent access to our services.